I recently had some blood drawn to have my cholesterol and blood sugar tested.
The doctor sent me a letter summarizing my test results.
The letter was a form, with very few little info on it.
It basically said:
Total Cholesterol: 139 (Goal is under 200)
HDL (Good) Cholesterol: 40 (Goal is over 40)
Blood Sugar (fasting): 93 (Goal is under 100, 130 diabetic)
[x] Your results are normal.
[x] Continue current treatment.
Now, I appreciate getting the results back, but they seem a bit sparse.
First of all, only Total and HDL cholesterol are listed.
LDL cholesterol is *probably* the difference, but I don’t know if there are other factors, it would have been good to see it broken out as a separate line item.
Triglycerides are missing. They are usually part of the bloodwork – did it not get done, or did the doctor omit the result when he passed it along?
I’m disappointed my HDL isn’t better than it is, I’ve been taking fish oil to try and boost that. I’ll switch from taking 2 fish oil pills a day to 4 and see if that helps…
The form also doesn’t show much info about upper and lower limits, areas outside normal, critical ranges… basically it’s just the numbers without context.
To give it proper context, on Saturday I wrote a PHP script to generate graphical charts (using GDlib, I was too lazy to install ImageMagick). I then did some poking around online to find out what normal and critical ranges are for each item. I used the doctor’s lackluster letter, and vitals data from when I last gave blood (which was the day after I had the blood drawn for the labs).
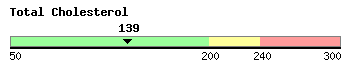
Click here to see the resulting charts (triglycerides is a fake number, just to show how it would appear if I had data for it).